

")


- Posts: 15
- Thank you received: 0
twd histogram
- bluecolumbia
- Topic Author
- Offline
- New Member
-

Less
More
3 years 4 months ago #1810
by bluecolumbia
twd histogram was created by bluecolumbia
hi ")
i'm a big fan of qtvlm, thank you to the developers for all of your efforts.
using 5.11-1 on windows, i've noticed that in the twd histogram the scale shows twa, not twd.
if this is adjustable, or if i'm missing some detail, please let me know.
also, in my opinion, the twd histogram would be more useful if it contained the real-time twd number, so that the sailor can see changes happen over a period of time; the average twd number is not as important.
thank you again for such a great piece of software.
...bluecolumbia
Please Log in or Create an account to join the conversation.
- maitai
- Offline
- Administrator
-

Less
More
- Posts: 1273
- Thank you received: 25
3 years 4 months ago #1811
by maitai
Replied by maitai on topic twd histogram
Hi,
Thanks for your interest in qtVlm.
The scale does not show TWA. The 0° value represents the latest average TWD value in the period (in your case 97° TWD). For the period it went from +/- 39° hence the min max of 58°/136°.
The idea in this sophisticated graph is to show the tendency of wind shifts around an average., and to try to anticipate.
The current raw value of TWD is shown in the led instruments.
--Philippe
Please Log in or Create an account to join the conversation.
- bluecolumbia
- Topic Author
- Offline
- New Member
-
Less
More
- Posts: 15
- Thank you received: 0
3 years 3 months ago #1827
by bluecolumbia
Replied by bluecolumbia on topic twd histogram
hi
thank you for your reply, now i understand better what you are doing with the twd histogram.
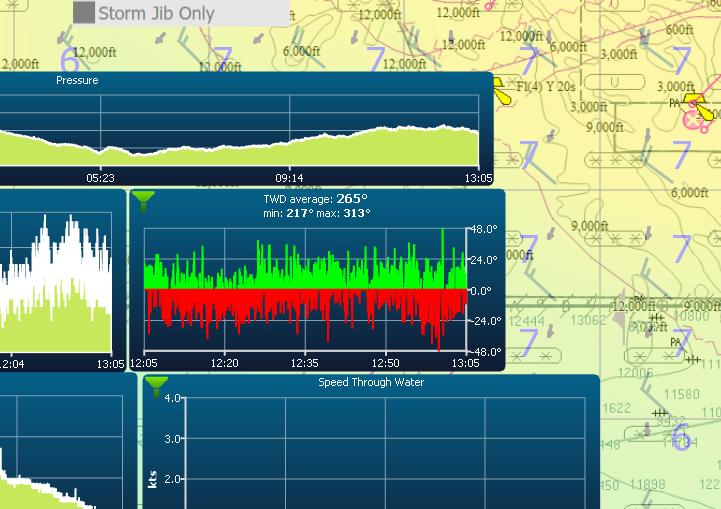
i've upgraded to 5.11.2. i think there may now be a problem with the twd histogram, please see my attached screenshot. (it looks like it is showing conflicting data points, with wind from two directions simultaneously.
there is a picture of the twd histogram in the documentation that has two scales, both the true direction and the comparison to average. i do think that including the true direction scale makes the histogram more useful.
i do not think the average number is useful to the sailor (though i can see that it is a useful number to the developer, in order to determine where to center the chart). the scale showing the comparison to the average is really just confusing, since it requires a mental calculation to get back to the actual true direction number. when i am sailing, i am mostly using the twd histogram to show a long history of the wind direction, and to detect a trend in current wind direction changes.
thank you again for all of your efforts
...bluecolumbia
thank you for your reply, now i understand better what you are doing with the twd histogram.
i've upgraded to 5.11.2. i think there may now be a problem with the twd histogram, please see my attached screenshot. (it looks like it is showing conflicting data points, with wind from two directions simultaneously.
there is a picture of the twd histogram in the documentation that has two scales, both the true direction and the comparison to average. i do think that including the true direction scale makes the histogram more useful.
i do not think the average number is useful to the sailor (though i can see that it is a useful number to the developer, in order to determine where to center the chart). the scale showing the comparison to the average is really just confusing, since it requires a mental calculation to get back to the actual true direction number. when i am sailing, i am mostly using the twd histogram to show a long history of the wind direction, and to detect a trend in current wind direction changes.
thank you again for all of your efforts
...bluecolumbia
Please Log in or Create an account to join the conversation.
- maitai
- Offline
- Administrator
-
Less
More
- Posts: 1273
- Thank you received: 25
3 years 3 months ago #1832
by maitai
Replied by maitai on topic twd histogram
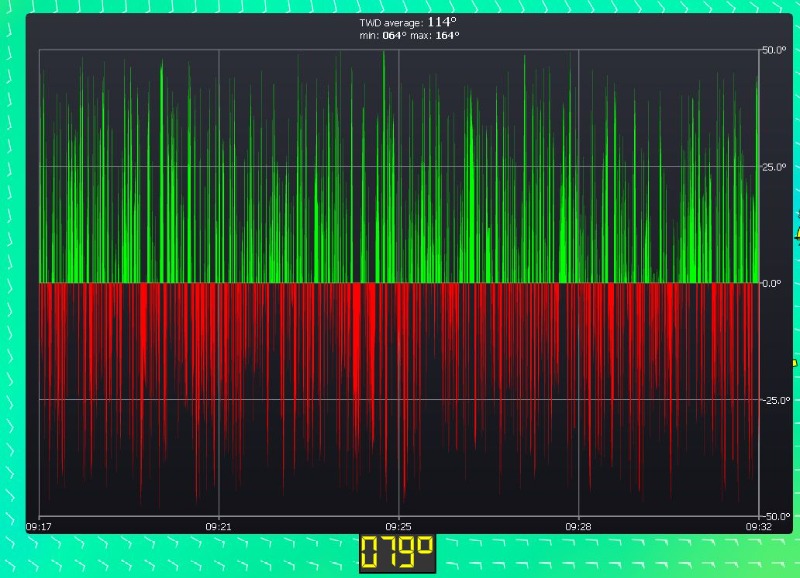
L'impression que le vent vient de 2 directions à la fois est due au fait que la courbe a un contour de quelques pixels, je l'ai retiré ca sera plus clair (voir image jointe). La valeur instantanée du TWD est affichée dans le LCD, lequel peut très bien être déplacé proche de la courbe, comme ceci:
Please Log in or Create an account to join the conversation.
Time to create page: 0.113 seconds