

")


- Messages : 2
- Remerciements reçus 0
VDR for post race analysis of boat performance vs Polar
- johnp
- Auteur du sujet
- Hors Ligne
- Nouveau membre
-

Moins
Plus d'informations
il y a 3 ans 1 mois #1953
par johnp
VDR for post race analysis of boat performance vs Polar a été créé par johnp
Has anyone used the Voyage Data Recorder info to do post race analysis of a real boats performance vs the boats polar?
I've recently completed a 58 hour race where I used the VDR to record GPS and instrument data from the boat. I want to analyze how the boat performed compare to the Polars.
I've exported the VDR data to a .csv file and opened with Excel. I've found that the Lat and Lon data has been separated into 4 fields. The decimal portion of the Lat and Lon in separate fields. Similarly each of the instrument data loggings has been separated in to two fields each, one field for the whole number, as second field for the decimal portion.
Has anybody come up with any sort of tool that can use this data, join the whole number part with the decimal part and do some useful analysis? Here's a screen shot of the first few records of the exported file.
Is there a way that qtVlm can display histograms and statistics from this data as it does in the Routes:Edit Route:Histogram and Routes:Edit Route:Statistics?
Thanks,
John Purdy
Connexion ou Créer un compte pour participer à la conversation.
- maitai
- Hors Ligne
- Administrateur
-

Moins
Plus d'informations
- Messages : 1251
- Remerciements reçus 25
il y a 3 ans 1 mois #1954
par maitai
Réponse de maitai sur le sujet VDR for post race analysis of boat performance vs Polar
Hi,
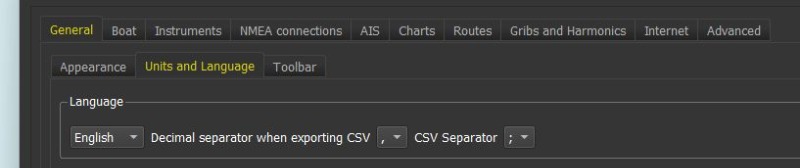
Either we have a bug in the export, either you didn't specify correctly in the general settings csv separator and decimal point for your localization. Excel is a bit dumb on that. You can also rename the file with a txt extension, open it in excel and it will ask you all about separator and decimal point.
There is no function for displaying graphs from the VDR, but once all data in a spreadsheet you can easily do it, or even write a macro for that.
--Philippe
Connexion ou Créer un compte pour participer à la conversation.
- johnp
- Auteur du sujet
- Hors Ligne
- Nouveau membre
-
Moins
Plus d'informations
- Messages : 2
- Remerciements reçus 0
il y a 3 ans 1 mois #1955
par johnp
Réponse de johnp sur le sujet VDR for post race analysis of boat performance vs Polar
I just found an online .db to .xlsx converter
www.rebasedata.com/convert-sqlite-to-xlsx-online
I've got the data in excel now as numbers I can graph. Still trying to figure out the best method to show boat performance vs polar
I've got the data in excel now as numbers I can graph. Still trying to figure out the best method to show boat performance vs polar
Connexion ou Créer un compte pour participer à la conversation.
- maitai
- Hors Ligne
- Administrateur
-
Moins
Plus d'informations
- Messages : 1251
- Remerciements reçus 25
il y a 3 ans 1 mois - il y a 3 ans 1 mois #1956
par maitai
Réponse de maitai sur le sujet VDR for post race analysis of boat performance vs Polar
Good, but the CSV export should work, can you please check that it is set correctly in this setting:
Dernière édition: il y a 3 ans 1 mois par maitai.
Connexion ou Créer un compte pour participer à la conversation.
Temps de génération de la page : 0.130 secondes